Building a Reaction Diffusion Audio Visualizer with p5.js
Date: 2020-12-21 | audio-reactive | c10ud | cases | javascript | p5js | projects |
Last month I released the first visualizations created from my reaction diffusion audio visualizer C10ud. I've previously shared basics around how the visualizer was built but wanted to shed more light on how the internals work, how I used it to create a full music video, and my takeaways from the project.
Overview
C10ud is an audio visualizer built on the Gray-Scott reaction diffusion model. It's extensible for additional metadata layers to mutate the reaction diffusion calculations to allow for customizability, procedural variation, and audio reactivity.
In layman's terms - it runs a reaction diffusion model and be configured to change how it reacts to sound.
Here's the visualization created for Moving Through Time a song by friends and artists Griffin Hanekamp and Steve is Space:
In the video we see a visualization consisting of different patterns split into several sections, some that are monochromatic and some that aren't. We'll be referring back to this video in examples throughout the post so when I talk about a Moving Through Time visualization, this is the video I'm talking about.
Let's talk about how C10ud works.
How it works
There are a few main parts to creating the video seen above and we'll go through each serially. By the end of this section you should have a good idea of how each component works and how it fits together.
One thing to note is that C10ud is really just a p5.js sketch at its core. It uses some utilities I've built over the years but there's nothing crazy going on under the hood.
Reaction Diffusion
The first thing we'll talk about is Reaction Diffusion - the model that runs at the core of c10ud. c10ud uses the Gray-Scott reaction diffusion model, which is a popular 'simulation of two virtual chemicals reacting and diffusing on a 2D grid' (see: Reaction-Diffusion Tutorial).
You can think of it like a function. This function works like this: given the states of two chemicals A and B on a 2D grid and some configuration settings about how A and B behave, return the new state of the world after some unit of time has passed. By continually iterating on this function, we can simulate the reaction and diffusion of these chemicals over time.
For an in-depth tutorial on how this might be written in code, The Coding Train has a great tutorial - Reaction Diffusion Algorithm in P5.JS
This simulation is at the core of c10ud. It's continually running throughout the visualization. The current state of the two virtual chemicals controls how a given pixel will be displayed - whether it's more displayType A or displayType B. Let's talk about configuration next and how displayType can effect how these chemicals are presented.
Configuration
We just talked about Gray-Scott reaction diffusion and how it simulates the interaction of two chemicals A and B. Now let's talk about how we might configure that to show something useful and interesting on the screen.
In the simple case, we could set the displayType of A to be the color white and the displayType of B to be the color black - each pixel would then be some color between white and black depending on its A-ness or B-ness.
An example output of this may look like:
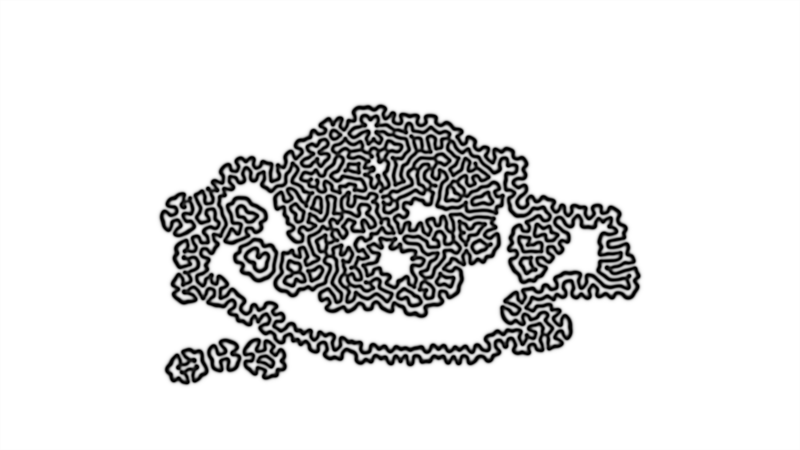
Black and white example
Of course A and B are just values (between 0 and 1) so really we could visualize that in many different ways like with emojis or ASCII characters or different shapes. We can go even further and instead of just changing how we're displaying the chemicals, we could take their current state and feed additional inputs back into the calculation - for instance by changing the reaction values at different parts of the grid or inserting populations of a chemical at a specific point.
I used a combination of these strategies in this iteration of c10ud.
The first display type modification I built was a color extension that produces a grid of colors it wants to be applied to the simulation. It takes in the reaction grid in each iteration so it can selectively determine where it wants to add colors based on its internal prerogative. This in turn can be scaled and I created lists of these components to produce the effect seen in the Moving Through Time visual starting around the 1 minute mark.
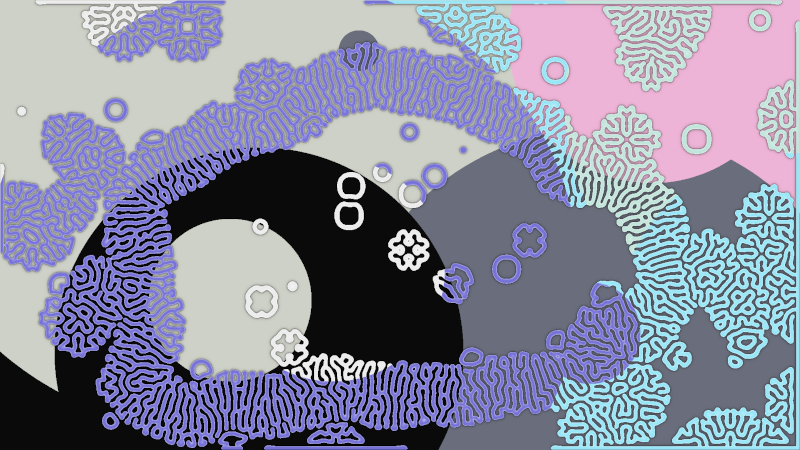
Color example
Throughout much of the Moving Through Time visual, I'm inserting new pools of chemical B into the grid when a beat occurs - this is easy to see in the section starting around the 3 minute mark.
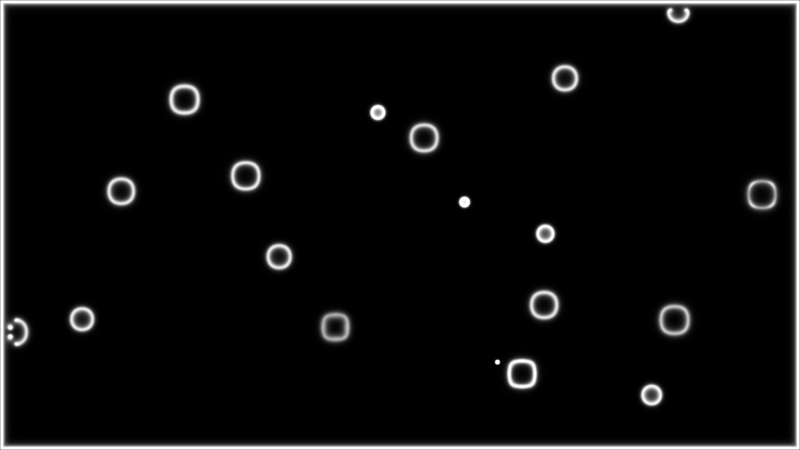
Chemical B insertion example
At the end of the day, this is all just code so you can get as creative as you can code.
Audio Reactivity
Adding audio reactivity into this project proved an interesting challenge. I'd created c10ud from the outset to be audio reactive but, unlike previous visualizations I've done, I was faced with the challenge of performance.
I'll get into why performance is a problem for audio reactivity in a sec but first I want to talk about why performance became a problem. Simply put - c10ud is doing a lot of synchronous calculations in the main loop. This means that each of these calculations must complete before the next loop can begin.
The calculations in question are the pixel-based reaction diffusion calculations that must run at least once each loop to compute the new states of chemicals A and B. On top of that, I have additional extension grid layers being computed to add things like color to my simulation. In the case of Moving Through Time, I recalculated the grid up to 20x for each sketch loop in some visualization scenes.
The result of this is that some scenes took up to an hour of processing time to compute one second of visualization at 30 frames / second. In fact the Moving Through Time visualization took 300+ hours of procesing time to complete!
This poses a few problems:
- That's a lot of processing time!
- How do you visualize audio if your visualization can't run at the speed of audio?
I dealt with
- by leaving my computer running for days on end
- we'll get into now
There's nothing wrong with a slow visualization. Many things take a long time to fully 'render'. However when you couple it with audio it becomes a problem as both audio and video need to be synced timewise in order to really feel like the visualization is reacting to the coupled audio.
The way I solved this was by setting a static framerate for the visualization and tracking my progression through the audio file with the total number of frames the visualization had computed. You can think of this kind of like this:
timeInSongSconds = totalFramesCalculated / framesPerSecond
Due to the performance I was seeing I knew that this wasn't going to be a real-time application so I decided to move the audio processing itself async. I ended up using the Python library librosa to do beat detection then output the values to a list which I gave to C10ud. This meant C10ud could use all of its compute on just doing the visualization and I didn't have to worry about other moving pieces at render time.
With this frame-based time sync between audio and video, we can then hook in an onBeatHandler (async of course) to add mutations to the simulation whenever there's a beat. This might look something like this:
let framesPerSecond = 30
let totalFramesSimulated = 0
let allBeatsInSeconds = [0.5, 1, ...]
let currentBeatPointer = 0

draw() {
    let currentRealTimeSeconds = totalFramesSimulated / framesPerSecond
    if( currentBeatPointer < allBeatsInSeconds.length
        && currentRealTimeSeconds > allBeatsInSeconds[currentBeatPointer]) {
        onBeatHandler()
        currentBeatPointer++
    }

    totalFramesSimulated++
}
And voila - async audio reactivity!
Recording and Stitching
At this point we understand how the core simulation works, how we can introduce customizability and mutations into that simulation, and how we might make it react to audio. Now how do we get a recording of this whole thing?
Well usually I'd just use something like OBS studio to record my screen while I'm running a visualization (see Prickly and Monoform). This has the benefit of being really simple but the downside of requiring manual input. That's not really a big deal when it's a 3-5 minute song.
However since C10ud runs too slow to do a real-time visualization, it's not feasible to manually capture the screen nor would it produce a particularly high resolution video as you'd have to speed it up by some amount of time and there's no guarantee what the visualization frame to real-time conversion is or that it remains constant throughout. This means we basically need to have our recording method plugged into the visualization directly to ensure we're getting the information we need at the rate we need it.
To do this, I decided to just output the canvas as an image on each iteration. We can then stitch together these frame captures using the frameRate defined in the audio reactivity section to get a video that matches the visualization's understanding of time. To do the stitching, I used kdenlive's import slideshow clip capability but I'm sure there are many other ways to convert from images to videos as well.
After some experimentation, I found that exporting a frame every 5 simulation iterations resulted in the best simulation videos and updated the totalFramesSimulated to currentRealTimeSeconds calculations to reflect that.
Putting it all together
Those are basically all the components that make up C10ud and that were used to create my visualization of Moving Through Time. In this section I'm going to give a brief walkthrough of how they all fit together before moving onto some takeaways from the project.
For this section, I'm going to go through the components as I might if I were creating a new visualization for a new song. Let's say I have song X and I'm creating visualization Y to make this more concise.
Creating visualization Y based on song X:
The first thing I'd do is run a custom script on song X that outputs all the beat times - for this I used the Python Librosa library. I'll then take those beat times and feed it into C10ud. As described in audio reactivity we'll use these beat times to tell C10ud when it should make changes to the visualization.
The next thing to do is break the song into sections. Because C10ud runs so slow, I found it useful to choose 20-60 second sections to visualize at one time. This gives me several checkpoints at which I can check in on the visualization thus far and make any changes as necessary. What I really don't want to be doing is visualizing a 355 second song and then realizing hundreds of hours in that I was using the wrong configurations. Moreover this gives me a natural place to change core visualization configurations to better fit what's going on in the song - something I did throughout the Moving Through Time visualization.
Once I figured out what these sections would be and had a plan for how I wanted each section to simulate, I started simulating. I found that it was best to do the simulations in sequence. This is useful because it's simple but it also has the property of allowing you to make the visualization sections flow into each other. I accomplished this by building a simple seeding script that could take in a frame of visualization and approximate the appropriate A / B values to use to recreate that. The script I created is very simple which is why you'll see a lot of sections beginning and ending with just white and black colors.
After simulating each section, I used kdenlive to stitch each section into a video clip and then to stitch all of the video clips together into one video with the target song X as the audio.
That's it. That's how I create a visualization Y from C10ud.
Takeaways
Now for a few takeaways and from this project.
Choose the right technology
The first is that choosing the right technology is crucial to the success of a project. C10ud is built with p5.js which is a great creative library packed with a lot of power and flexibility in an easy-to-learn package. But it has some limitations - namely that it runs in the browser using javascript.
Javascript has become a very good language (I'm lukewarm to it) and browsers are getting better and better but it's just not the best place to be doing really heavy calculations. In my case I built a calculation-heavy script and shoved it off to the browser to deal with then paid the price in hundreds of hours of processing time.
There are likely a lot of different choices I could've made to mitigate this issue.
- Chosen a less computationally-heavy algorithm
- Coded it more efficiently
- Used other browser-based technologies like WebGL and shaders to increase performance
- Used Web Assembly to move these calculations out of JS
- Probably a lot more
I've used Javascript for many of my past creative projects and I'll likely continue to use it for many creative projects in the future. As I said above, it's fast, flexible, and easy to use - so it's a good fit for a lot of projects. But this experience was a good reminder that these choices do matter and that it can be beneficial to step outside of your tech comfort zone to try new ones out.
It doesn't have to be perfect
One of the biggest things I've been thinking about as a result of this project and that I want people to take away from this is that projects don't have to be perfect to serve their purpose. C10ud is a snapshot of the skills and patterns I'm using today for my creative technology but it's a long shot from being perfect - or even excellent - code.
That's okay. It serves its purpose and gives me the flexibility and control that I wanted for my visualizations. It's not optimal that I have to manually stitch together my frames and audio but it's okay for my use cases and doing so likely saved me several hours of dev time that I could use for other things.
At the end of the day a project just needs to solve the problem it was created for. For me, that was building an audio visualizer using reaction diffusion. C10ud does that. It's no the fastest or prettiest or cleanest but it does that.
That's sufficient for my purposes.
Fin
By now I hope you understand how I duct taped this music video together and have an idea of how you might make one yourself.
If you liked this - let me know below and connect with me to get updates when I release more posts like this.
If you didn't like this: Let me know what you didn't like in the comments below - this helps me learn and grow.
If you've got a few minutes, go give Moving Through Time a listen, like, and share:
In Audio Reactivity,
-HAMY.OUT
Want more like this?
The best way to support my work is to like / comment / share for the algorithm and subscribe for future updates.