Fathom Analytics - Dashboard Walkthrough
Essay - Published: 2023.03.01 | 3 min read (936 words)
business | fathom-analytics | walkthrough
DISCLOSURE: If you buy through affiliate links, I may earn a small commission. (disclosures)
Fathom Analytics has quickly become my default web analytics provider for my projects. In this post I'm going to walkthrough the default Fathom dashboard to give a sense of what capabilities it has and what makes it so easy to use.
Fathom Analytics
Fathom Analytics is my go-to for web analytics. I used Google Analytics for years but found the new-age of simple, privacy-first analytics providers to win out for my projects.
Specifically, I like Fathom because:
- Simple
- Privacy-first
- Cheap (compared to similar services)
This makes it a good Simple Scalable System for analytics in my projects.
Get a $10 credit for Fathom Analytics.
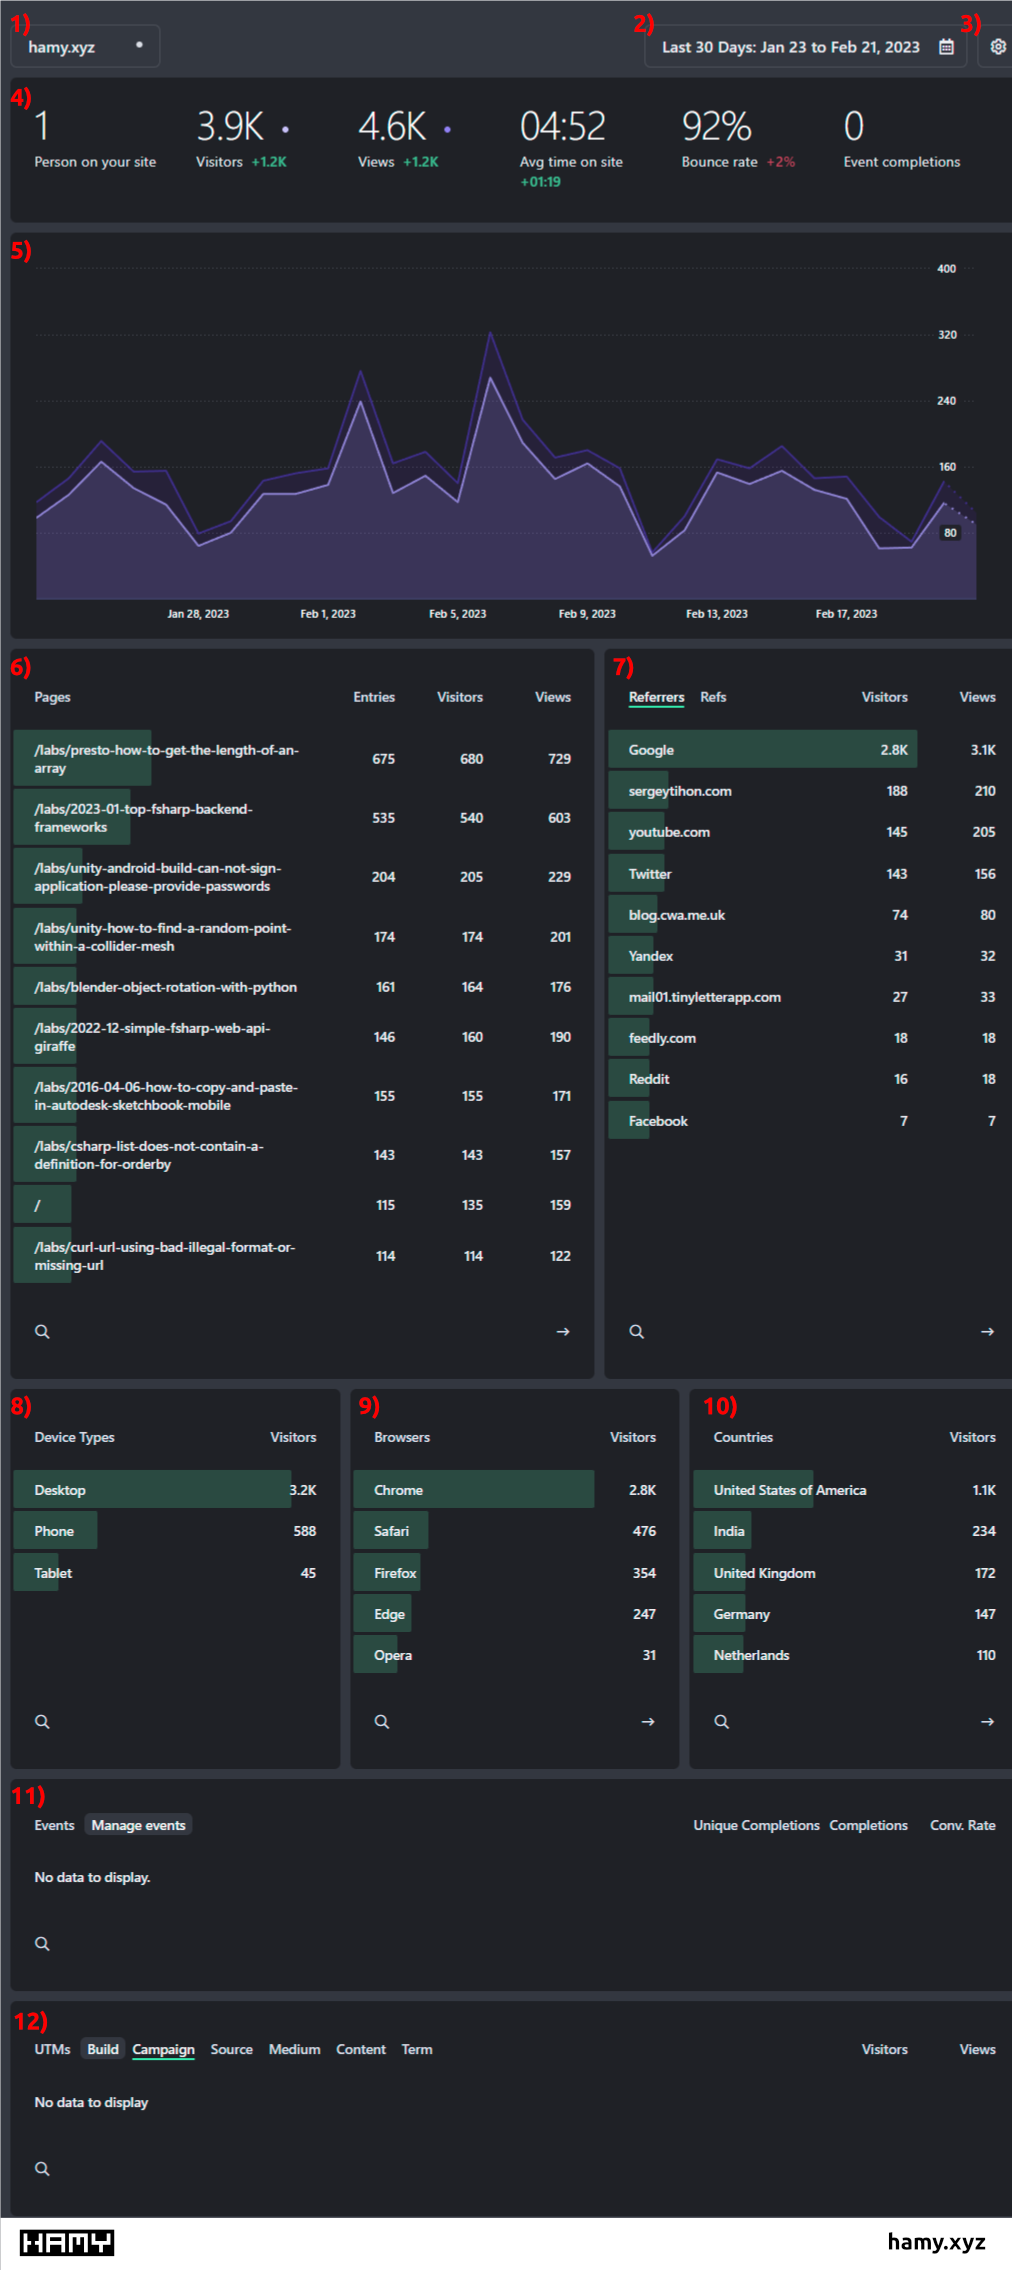
Fathom Analytics Dashboard screenshot with Annotations
Fathom Analytics Dashboard
In the rest of this post we'll walk through each of the sections of the Fathom Analytics dashboard and what it does. Each number corresponds to the numbered section in the above screenshot of my live site.
Each section typically has a way to:
- Select an aggregation filter
- Filter results in the section
- Iterate over results in the section
We'll touch on how to do these in each section but I encourage you to click around as well.
1 - Site Picker
The first section to the top left is a site picker drop-down. This lets you quickly switch between the different sites you're tracking.
I typically run 10s of projects in parallel so I've found this quick dropdown to be much easier to use than other providers.
2 - Date Picker
The date picker allows you to choose the time range to see analytics for. This will update the time range for both the stats time line and all aggregate breakdowns in the dashboard.
You can manually choose the time range and there's a few common time ranges to select like this month, last month, this year, etc.
3 - Settings
This is how you access the settings for your overall account and specific sites. This is where you can find your site ID and embed code as well as add new events to your site.
Use Fathom Analytics with SvelteKit
4 - Stats Highlights
The stats highlights bar holds topline aggregates for your chosen filters. With no filters present (just the time range) it will show totals for things like:
- Current Visitors
- Visitors over time range
- Views over time range
- Average time on site
- Bounce Rate
- Event Completions
This becomes much more powerful when you add additional filters (like filtering to a specific referrer or page) as it will show the topline aggregates with the filters applied.
5 - Stats Timeline
The Stats Timeline will show you analytics data points over time. The shown timeline will change based on the time range you have selected and any filters you have applied.
You can select and deselect topline stats to toggle whether they appear on the timeline.
6 - Stats by Page
Shows stats breakdowns by page on your site - usually denoted with the page's url. Shows Entries (hits where this was the first page), visitors (unique visitors), and views (individual hits) to the page.
Selecting filters on the page will also filter the aggregates for each url.
You can search through the page urls by clicking the magnifying glass and page through the results using the arrow icon.
7 - Stats by Referrer
Shows stats breakdowns by the referrer to your site - for example Google, Reddit, and YouTube may all be referrers if they sent traffic to your site.
Selecting filters on the page will also filter the aggregates by referral.
You can search through the referrers by clicking the magnifying glass and iterate through using the arrow icon.
8 - Stats by Device Type
Shows visitor stats by device type. Usually doesn't get too specific but gives you broad categories like:
- Desktop
- Phone
- Tablet
Selecting filters on the page will also filter the aggregates.
9 - Stats by Browser
Shows visitor stats by browser like Chrome, Safari, Firefox, etc.
Selecting filters on the page will also filter the aggregates.
10 - Stats by Country
Shows visitor stats by country the visitor's hit came from.
Selecting filters on the page will also filter the aggregates.
11 - Analytics Events Stats
If you have events setup and logging on your page, you will see stats by event here. Typically it will log stats like:
- Unique completions - total completions from a unique visitor
- Completions - total completions
- Conversion rate - Completions / visits
You can click the Manage Events button to go to the site's events settings page. This setting is also navigable via the Settings button.
12 - UTM Stats
UTMs are typically ids attached to a url that help to identify more info to track about the url. An example might be for a specific newsletter promotion, your UTM may be - reallycoolnewsletter-feb2023 - so we know where this traffic is coming from.
Stats for each UTM breakout is shown here including Visitors and Views.
You can navigate to the UTM settings page by clicking Build or navigating through the Settings screens using the Settings button.
Next Steps
You should now have a pretty good idea of what the Fathom Analytics dashboard looks like and how to use it.
Want more like this?
The best way to support my work is to like / comment / share this post on your favorite socials.