Measuring the impact of my submission to Hacker News that hit the front page (for 5 minutes)
Date: 2019-12-08 |
A few weeks ago I made a submission to Hacker News that hit the front page. My site stats have finally returned to normalish so I thought I'd do a lightweight analysis of that submission's effect on my site stats.
TL;DR: My submission that hit the front page of Hacker News for ~5 mins got as many visitors that day as I get in a month, increased my average visitor rate for the next week, and increased visits to my most valuable pages (those of my projects) by ~148% over that period
the submission
First a little context on the submission.
The original post was about my favorite programming languages to use in 2019 - one commenter aptly described it as a programming language tier list. You can find that post here: https://hamy.xyz/labs/2019-programming-language-hierarchy/
I believe I submitted the post to Hacker News somewhere between 12 and 3PM as that's the first time I start receiving a traffic hump that day according to Google Analytics. You can view my HN submission here: https://news.ycombinator.com/item?id=21660264
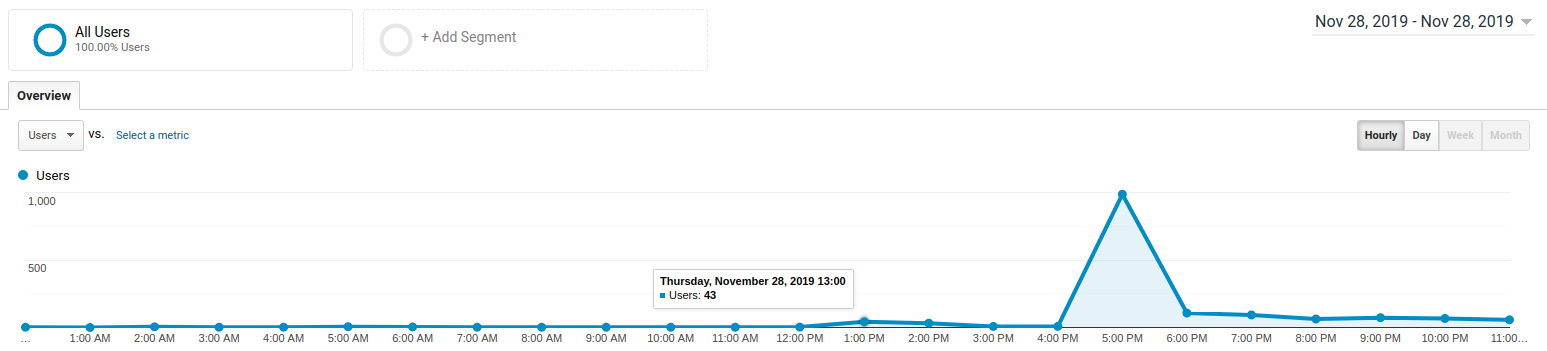
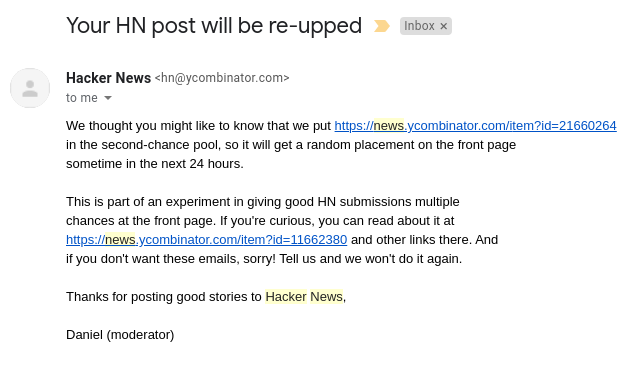
We can see the big traffic hump around 5PM which is when I think the post made it to the front page (I don't have any proof of this cause I could never see it on the front page). However, that data, coupled with this email from HN stating that my post would be pushed to the front page at some point within the next 24 hours, means that even if it didn't hit front page at that point, it did hit it at some point (though we'll see that traffic never rose above that 5PM peak).
So it was a technical post that, I think, was well timed to peak the interest of turkey-laden readers.
top-level stats
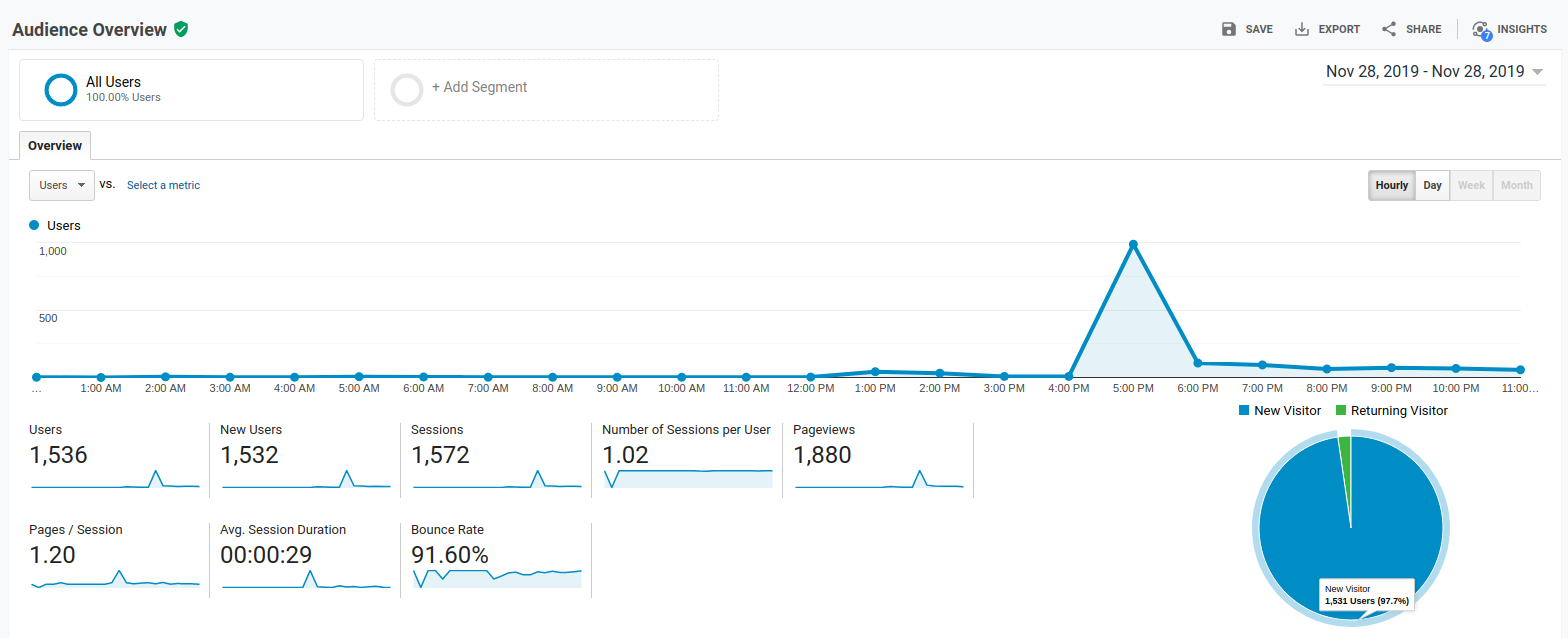
From my Audience Overview, we can see that on day of submission I got traffic from 1,536 users, 1,532 (99.7%) of which were new to my site which is a 2363% increase in daily users over my current projected average of 65 users each day. There's a small bump in sessions around 12-1 PM then a large spike in sessions at 5PM (reaching a peak of 987 sessions / hour, an increase of about 36555% over my average of 2.7 sessions / hour based on daily user traffic of 65) after which the hourly session rate levels off at around 65 sessions (an increase of ~2400% from average).
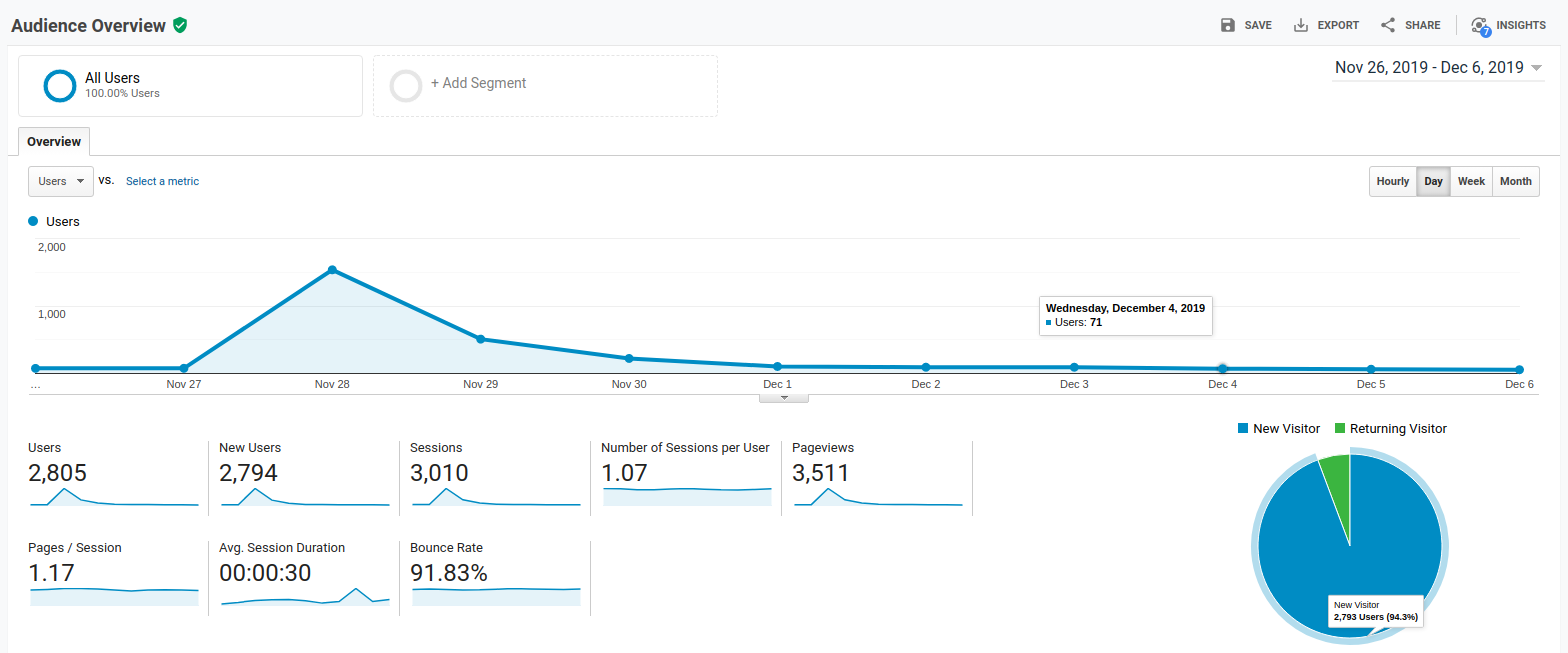
If we extend the time frame we're looking at and change the buckets to day, we can see that my traffic doesn't return to normal for about a week after the event.
.png)
In October of this year, HAMY.LABS received ~1600 visitors which means that the day-of-submission's traffic of 1,536 users single-handedly doubled my monthly visitors.
For me, the most valuable pages I can get people to look at is that of my projects. This is because I like building projects and thus want to show them off and because I'm making like 0 money off of ads. So of course, I added ample project callouts in my submission.
Let's look at my visitors by who's looking at random stuff vs who's coming to look at my projects.
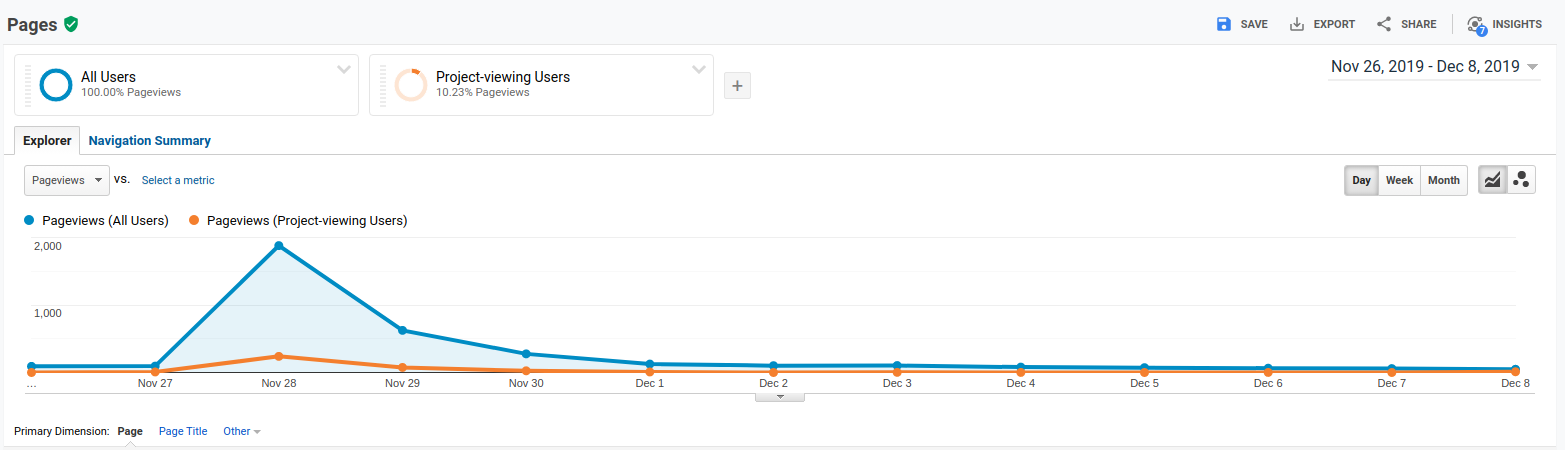
In this cut, we can see that views of my project pages (defined as those who also viewed a project page in their session) does grow proportionally with views to my submission, with around 10% of all page views going to project pages vs other pages. This increase led to ~370 project page views vs my usual ~150 page views, a 148% increase in project (read: valuable) page views.
fin
That's all the data crunching I've got in me today, but yeah HN can do wonders for your tiny site too so #keepsubmitting.
Want more like this?
The best / easiest way to support my work is by subscribing for future updates and sharing with your network.