I can serve ~533,000 visitors (~927,000 page views) of my sites per month for free with Netlify
Date: 2020-02-25 | netlify | iamhamy | hamship |
Last year I moved my site hosting from Google Kubernetes Engine to Netlify's free tier, saving ~$1,000 / year in hosting costs. It was a great choice for me as I was way underutilizing my resources and getting frustrated with regular maintenance. In 2019, I had 21,439 visitors to my sites so today I wanted to sit down and calculate how much head room I had before hitting the capacity of Netlify's free tier.
In this post, I'll try to do just that.
the approach
I'm going to try to tackle this problem in two steps.
- Calculate the approximate number of page views the Netlify free tier can handle
- Calcuate the approximate number of visitors the Netlify free tier can handle
I want to do 1 for #science, but feel that 2 is necessary as it's closer to what actual user behavior is - not every user is going to just go to one page. Visitor count is also closer to what I goal on, so using some real data may allow us to get a better read on realistic capacity and a number on capacity I really care about.
Before going further, I should note that I'm doing this calculation on my site and my site's data. Both its payload and the behavior of its visitors is likely different from any other site, so while this may be useful as a rough estimate for the free tier capacity for other sites it should by no means be taken as a hard cap. I'll also be using Google Chrome for this cause that's what I'm most used to.
Moving on.
calculating page view capacity
Netlify currently has a bandwidth limit of 100GB in the free tier. To find out the page view capacity of the free tier, I just need to calculate the average payload size of my sites and divide the bandwidth limit by that.
calculating the average payload of my sites
I currently have 8 sites hosted on my Netlify account but the top 4 make up ~98% of their traffic so I'll be focusing just on those to streamline the analysis. Those sites:
- hamy.xyz
- hamy.xyz
- hamy.xyz
- art.hamy.xyz
To make these calculations even easier, last year I moved the sites included in our analysis to a central Hugo theme to reduce my maintenance activities. This means that pages on those sites render in a near identical manner and thus we should be able to find the average payload size by taking a sampling of payloads off pages of any one of these sites and then projecting that value across the remaining sites.
If we start out at hamy.xyz and click through to my 2019 in review with a browser's Network tab open we'll be able to see the amount of data required to render it.
Note: if following along on your own Chrome, it'll be easiest and most accurate to navigate to the page, open the network tab, then hard refresh (in Chrome this is CTRL + SHIFT + R) to force Chrome to not pull anything from cache so you can see the full network load.
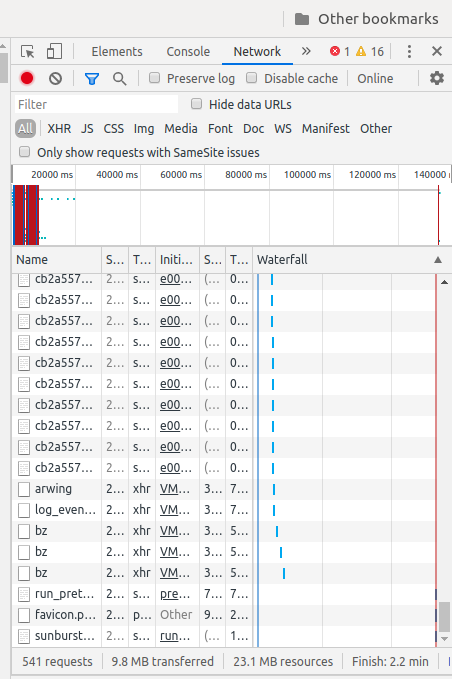
The network tab of my 2019 in review post
When we do that we get a whoppping 9.8 MB transferred! With a page that size, the Netlify free tier would only support ~10,204 visitors / month.
netlify_bandwidth_cap_giga_bytes: float = 100.0
netlify_bandwidth_cap_mega_bytes: float = netlify_bandwidth_cap_giga_bytes * 1000

size_of_2019_review_page_mega_bytes: float = 9.8

number_of_page_views_possible_on_2019_review: float = netlify_bandwidth_cap_mega_bytes / size_of_2019_review_page_mega_bytes
But this value is wrong for my sites.
For the uninitiated, 9.8 MB is a lot of data to serve a single web page. If we take a closer look at the network traffic that navigating to my review causes, we see that 4.8 MB of that can be attributed to image downloads and 4.1 MB is due to JS downloads, which makes sense when we look at the number of image and JS-driven media embeds in that post.
The reason the 10,204 visitor / month cap is wrong for my sites is that a majority of those 9.8 MB isn't actually served by me and a majority of the parts that are (the images directly embedded in the page) aren't served by Netlify but by, in my case, Google Cloud.
So to find out the approximate amount of data Netlify is serving on any given request, I can't just use any page - I need to use a page that is serving all, or at least most, of its data from Netlify.
To do this, we'll use a post that has no embeds (direct or otherwise) and we'll turn on our adblocker to stop the browser from fetching any ads which would add to our data count. The easiest pages for this are my About and Connect pages which have no ads, no embeds, and a single image to worry about.
If we look at the network tab here, we see that the total payload size is 155 KB or 0.155 MB. By hovering over each item in there and removing each item that isn't served from my domain hamy.xyz, we can actually get a pretty good picture of what's being served from Netlify and what's not.
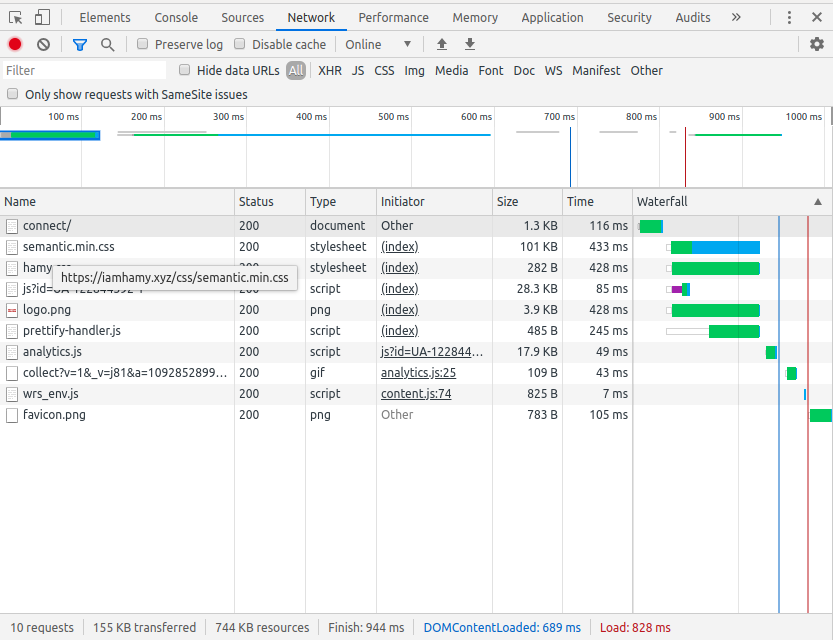
The network tab of my Connect page
What we remove by doing this:
- A google tag manager blob (28.3 KB)
- The Google Analytics payload (17.9 KB)
- Some other Google Analytics thing and js thing (~1KB)
Which brings our total average payload downloaded from Netlify per page view to ~107.8 KB.
total_stripped_page_payload_kilo_bytes: float = 155.0

netlify_served_stripped_page_payload_kilo_bytes: float = total_stripped_page_payload_kilo_bytes - 28.3 - 17.9 - 1
Not bad! And about 90x smaller than our initial (contrived) example would've found!
calculating free tier page view capacity
Equipped with our new baseline for page payload, we can calculate the number of pageviews I could get on my sites while remaining within Netlify's free tier. This means that I could host ~927,643 page views / month and still stay within Netlify's free tier.
Which, I'll admit, is a whole lot more than I thought I'd see here!
calculating visitor capacity
We now know the Netlify free tier can support a pretty huge number of page views, but page views aren't the only metric that matters. We also have to think about it in terms of visitors - unique people coming to your site, clicking around, and doing stuff. One visitor may stay on a single page in their visit, or they may click through to several pages, which means visitor capacity will likely be a factor smaller than total page view capacity.
I could just look up the average number of pages a user looks at on a website to calculate this, but I have real data for users on my sites in Google Analytics so I'll use that instead. Across the four sites in our calculation and the last 30 days, site behavior was:
- hamy.xyz - 60 visitors, 1.46 pages / session
- hamy.xyz - 115 visitors, 1.90 pages / session
- hamy.xyz - 2,092 visitors, 1.10 pages / session
- art.hamy.xyz - 13 visitors, 2.59 pages / session
If we take a weighted average of this behavior, we get ~1.16 pages / session.
front_visitors: int = 60
front_pps: float = 1.46
blog_visitors: int = 115
blog_pps: float = 1.90
labs_visitors: int = 2092
labs_pps: float = 1.10
art_visitors: int = 13
art_pps: float = 2.59

weighted_average_pages_per_visitor = (front_visitors * front_pps + blog_visitors * blog_pps + labs_visitors * labs_pps + art_visitors * art_pps) / (front_visitors + blog_visitors + labs_visitors + art_visitors)
To be robust to user behavior changing and some buffer room in case my previous calculations are a little high, let's increase the pages / session we're expecting by ~50% to ~1.74 pages / session.
weighted_average_pages_per_visitor_with_buffer: float = weighted_average_pages_per_visitor * 1.5
When we do this, we see that if each visitor clicks around to an average of 1.74 pages per visit, we can support ~533,901 visitors / month and stay within the Netlify free tier.
number_of_visitors_supported_by_free_tier: float = number_of_page_views_possible_on_stripped_payload / weighted_average_pages_per_visitor_with_buffer
fin
Before concluding I wanted to call out a few areas I can think of where these calculations could go awry:
- we may be under estimating average page view payload size (and thus overestimating total pageview capacity) as most pages on those sites will have a higher payload size than the About or Contact pages mentioned, even if it's just due to number of words in each post that have to be downloaded
- we may be under estimating visitor capacity as browsers do aggressively cache web assets, meaning on subsequent page views in a session we could expect most browsers for most visitors to only download what's changed, holding onto assets that likely won't - the big one in my case is my semantic.min.css which is 101KB all by itself
- we may be under estimating visitor capacity as I added in a 50% buffer to average pages / session but I'd still rather capacity plan a little lower than a little higher
Those numbers were way different than I was expecting so if you've got feedback (like maybe I did some math wrong), please let me know! Otherwise if you liked this post consider subscribing or just taking a look at my projects which I sink a lot of time, effort, and #love into.
Thanks for reading!
-HAMY.OUT
Want more like this?
The best / easiest way to support my work is by subscribing for future updates and sharing with your network.