Savings Commitment Rate vs Savings Rate for Financial Health Tracking
Date: 2021-07-04 | finance |
Overview
I'm currently striving for Financial Independence. I track my success towards this goal via:
- % FI - My % progress to the net worth I need to achieve Financial Independence at a 3% withdrawal rate
- Savings Commitment Rate - The subject of this post
In this post I'll talk about Savings Commitment Rate, its connection to Savings Rate, and why I track Savings Commitment Rate over Savings Rate as a financial health indicator.
Why I'm Writing this Post
I was talking to Megna today about finances. We got to talking about savings rate and how each of us calculates it.
I realized that the Savings Rate I presented to people in my Financial Reviews was actually not a Savings Rate at all - at least not in the traditional sense. This is confusing and misleading for my readers.
So I'm writing this post to clear up any confusion and provide an RFC for future reference.
Savings Rate
First let's talk about Savings Rate. It's typically calculated for a given time period with something like:
Savings Rate = $ saved / $ earned
Case 1: Simple Savings Rate
A person makes $100,000 / year and saves $40,000 / year
Their savings rate for the year would be something like $40,000 / $100,000 = 40%
Simple right?
On the surface yes but I think there may be some hidden complexity here:
- Are the earnings before or after taxes?
- Should you include retirement accounts?
- What about principal on loans / assets?
There are many ways to calculate savings rate. The best way likely depends on your own situation, goals, and use cases. Some reads you may find helpful:
In most cases I think just having a number you track should give you some positive / negative signal for financial health so starting to track is better than not tracking at all. However I'm here to present another method for tracking financial health that I believe provides a better measure of financial health without many of these edge cases.
Enter Savings Commitment Rate.
Savings Commitment Rate
Savings Commitment Rate is the metric I've used to track my financial health for the past several years (See My 2020 Review). I calculate this every month with aggregate metrics each quarter, half, and year.
The goal of Savings Commitment Rate is the same as that of Savings Rate:
- Track how much we have
I like Savings Commitment Rate over Savings Rate because I believe it:
- Tracks actual money commitments vs allocations
- Encourages saving at commitment time rather than just allocation time, leading to higher incentive alignment and better outcomes
- Is simpler to calculate, harder to mess up
Before we talk about what the Savings Commitment Rate is, let's talk about some terms:
- Allocation - When I say allocation, I mean that money has been assigned a job but hasn't actually been committed to that job yet. For example, let's say that you have a grocery budget and you budget $300 for groceries in a given month. That $300 is allocated to groceries but it could still be moved to other budgets / used for other things. It's allocated to groceries but there's no guarantee it will actually be used for that.
- Commitment - When I say commitment, I mean that money has been committed somewhere and its assignment can no longer be changed. Commitments typically happen when money leaves your control (e.g. is spent or invested). In our grocery budget example, if we were to spend $200 of it on groceries we'd have $200 committed to grocery expenses with the other $100 uncommitted (or potentially committed in another category).
So now that we understand the difference between allocations and commitments, let's talk Savings Commitment Rate. It's calculated for a given time period as:
Savings Commitment Rate = $ saved (committed) / $ total (committed)

(where $ total (committed) = $ saved (committed) + $ spent (committed))
This may look a little more complicated than Savings Rate above but I promise it's not. The extra terms here are due to making the complexity explicit and visible as opposed to implicit and invisible (See hidden complexity in Savings Rate above).
Savings Rate attempts to track $ saved / $ we have by taking $ saved / $ earned. However there are a few problems with this:
$ earnedhas many potential calculations with widely varying outcomes$ earned - $ saved != $ spent (committed)in many cases. This is implicitly tracking$ allocatedbut not necessarily committed which obscures the actual money movements in your accounts
Where Savings Rate comes at the problem from the top down (i.e. start with total and derive subcomponents), Savings Commitment Rate comes at the problem from the bottom up (i.e. look at subcomponents and derive total). It looks only at money that was committed in a given month, which means that we're directly tracking money that is moving from our accounts and the jobs they're committed to as opposed to potential futures of that money.
Let's look at some examples and how each measure matches up:
Case 2: Case 1 Savings Rate vs Savings Commitment Rate
A person makes $100,000 / year and saves $40,000 / year.
Savings Rate = $40,000 / $100,000 = 40% / year
Savings Commitment Rate = $40,000 / $40,000 + $ spent (committed)
Ta-da we've just found a missing variable and missing data, explicitly exposing the hidden complexity behind Savings Rate. Let's walk through some examples of what $ spent (committed) might equal based on hidden attributes in the prompt.
- If spent (committed) = $60,000`
- If $100,000 was after tax with spent (committed) = $40,000 = $60,000 not saved - $20,000 not committed to spending`
- If spent (committed) = $40,000 = $60,000 not saved - $60,000 * 0.33 tax`
Savings Commitment Rate removes the hidden complexity by telling you exactly what it needs to be calculated. $ saved (committed) and $ spent (committed). We don't care about your future plans, we don't care about your tax rate, we don't care about your principal. Just tell us what you saved and what you spent and we'll give you a metric to track.
Case 3: Big purchases / purchases in a month after you earn money
Scenario:
- A person has $3k budgeted and saved up for a trip. They spend it this month.
- Let's say they make $10k / month.
- They've saved their trip money in previous months, no money going to it from this month.
- Let's say they save $5k / month and spend (commit) the other $5k / month
Savings Rate = $5k saved / $10k earned = 50%
Savings Commitment Rate = $5k saved / $5k saved + $8k spent ($5k normal expenses + $3k trip) = 38%
Ta-da savings rate says that nothing changed in your normal expenses. Your financial health this month is the same as last month.
Savings Commitment Rate on the other hand is like you're still saving a good bit but you def spent a lot. This month isn't like the last month because this month you spent $3k on a trip!
Savings Commitment Rate focuses on actual money commitments in your accounts. If you spend a lot in a month, you are going to see this reflected in your Savings Commitment Rate.
I like this. It keeps me honest when I'm spending a lot. It reminds me that there are consequences to spending large amounts. Maybe next time I'll look for some deals so I can spend $2.5k instead of $3k. Maybe I'll do this for each of my budgets, leaving more budget for future commitments.
Case 4: Blowing your budget
Scenario:
- A person makes $10k / month
- They spend $12k this month
- They moved $2k to savings this month (idk, auto investments or something)
Savings Rate = $2k / $10k = 20%
Savings Commitment Rate = $2k / $14k = $2k / ($12k + $2k) 7.14%
In this case neither metric really captures the fact that you blew your budget. But Savings Commitment Rate is at least effected by your increased spending and showing you a corresponding regression.
Case 5: HAMY in 2020
The last scenario will be on real data from my 2020 Financial Review. Hopefully this will provide some insight into how this can be used in the real world and how each metric works with real data. I won't share the underlying data or actual money values but all of these metrics are computed based on real number values so they will still be accurate.
Savings Rate (2020 aggregate): 64%
Here we see my Savings Rate is quite volatile. This is likely due to how I track my spending (commitments) vs how I get paid datewise. I use YNAB to track my spending and only log spending when money actually leaves my accounts. For payments / bonuses I'll often get them near the end of the month yet my investments may not take place until early next month (think 1-4 business days), meaning some months are seeing some very high (impossible numbers) and very low (incorrect) numbers. For example, if I get a 10k bonus on the 30th of month 1 but it can't be invested til the 1st of month 2, that 10k is logged in my earnings of month 1 but my savings of month 2.
I could change this but it would take a lot of auditing and would actually be modifying the underlying data for the use of a metric which I don't like. The data is the source of truth, the measurement should work with it.
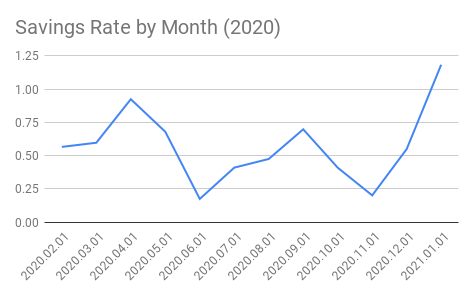
Savings Commitment Rate (2020 aggregate): 65%

Here we see that Savings Commitment Rate is also pretty volatile but is within normal (possible) ranges. This is because it doesn't assume that it has a max possible number, it just looks at the commitments that actually happened.
One thing to note is that the aggregate % over time of the two are actually quite close. We expect this to be the case with Savings Commitment Rate typically higher with much lower metrics on big spending months and Savings Rate going the opposite way.

Here we can see the spend and save breakdown for 2020. We can compare it to both the Savings Rate and Savings Commitment Rate graphs above and see how they moved accordingly.
In my data we see that Savings Rate is looking a lot more volatile, particularly when there's more money involved, whereas Savings Commitment Rate is really only moving when allocations are changed.
Conclusion
In the end you should track your financial health with the measurements that you find most useful for your position. I believe that Savings Commitment Rate provides a simple, hard to mess up metric that encourages good behaviors and closely tracks ground truth money commitments.
But this may not be the right choice for you, so do some homework and some case studies comparing your different options.
Yours in FI,
-HAMY.OUT
Want more like this?
The best / easiest way to support my work is by subscribing for future updates and sharing with your network.